Reports
Last modified on March 11, 2025
This feature is part of the Enterprise plan. If it is not enabled for your organization, please contact StrongDM at the StrongDM Help Center.
StrongDM Reports offer rich dashboards providing in-depth analysis of access grants to resources, organization posture and risks, and more. These dashboards can help StrongDM administrators and auditors ensure compliance and detect potential issues. This article describes the reporting dashboards available in the Admin UI.
All Dashboards
Dashboards may be viewed by users with the Administrator or Auditor permission level.
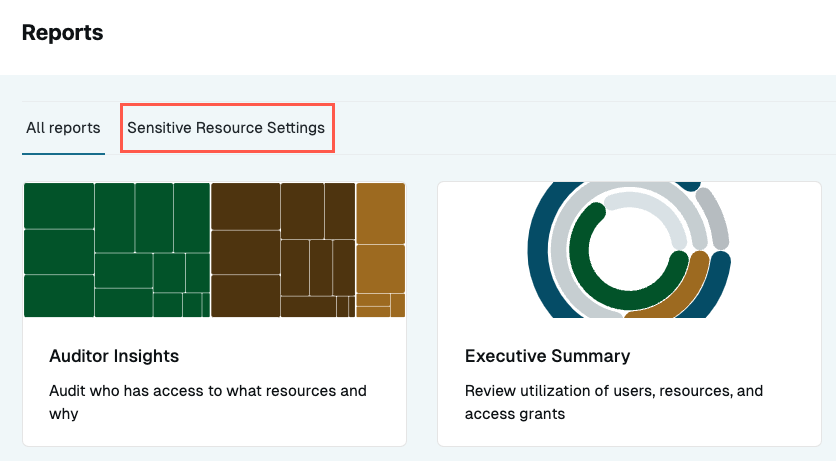
To view dashboards, log in to the Admin UI, and select Reports from the main navigation. The All reports tab displays all dashboards currently available to your organization:
Click on a dashboard card to view its contents. For each dashboard, you can do the following:
- View all metrics specific to the dashboard.
- Display data based on a specified date range.
- Download data as a CSV or JSON file.
- Search the data in your dashboards by manipulating the filters, or click into specific items in widgets to filter the displayed information further.
Dashboard Options
At the top right of any dashboard are several options:
- Download: Allows the dashboard data to be downloaded in CSV or JSON file formats
- Reload: Causes the dashboard to reload data from the cache
- Info: Opens the StrongDM Reports documentation
Download
You may view dashboards in the Admin UI, or you may download their data in CSV or JSON format. To download dashboard data, click the Download option at the top right of the dashboard, and choose the file format.
When filters are selected and applied to the dashboard, only the filtered data gets downloaded. If you want to download all data, not just the filtered data, use the Clear Filters button (located at the top of the dashboard, next to any filters currently set) to remove all filters, then click Apply Changes. Now, download the dashboard data and all data will be included in the download.
Reload
Metrics for all dashboards are refreshed throughout the day. You can click the Reload dashboard option to retrieve the latest data and refresh the dashboard at any time.
Search and Filter
The Search field embedded into dashboard cards allows you to find and display specific data, such as the name of a user accessing a resource, a specific resource type, or a tag. You can enter any text or string into the Search field.
Similarly, filters allow you to display specific data, such as for date or temporary grants. Every active filter is presented at the top of each dashboard. You can select filters from multiple dashboard cards to narrow results even further.
When set, the filters are encoded into the dashboard’s URL (for example, https://app.strongdm.com/app/reports/all-reports/dashboard/auditor?Date=7+day), enabling you to share or bookmark your filter configuration.
To clear filters, click the Clear Filters button and then click Apply Changes.
Sensitive Resource Settings
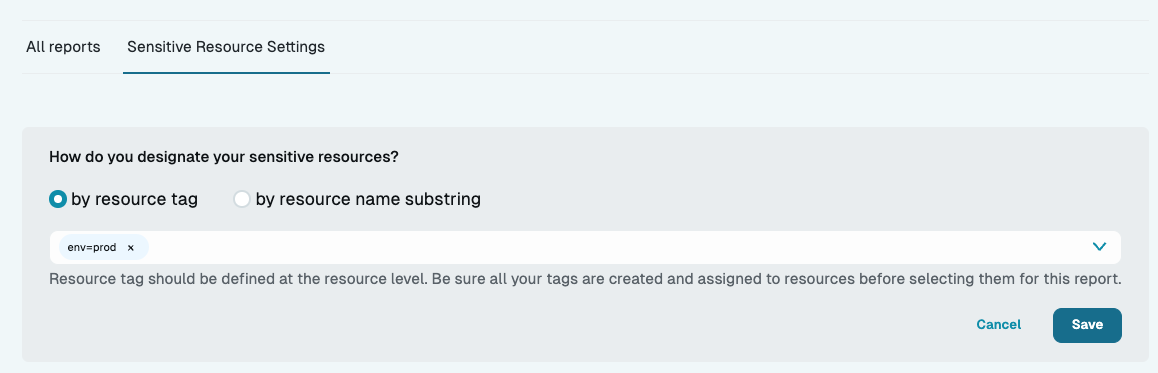
The Sensitive Resource Settings tab is where you define which resources are considered sensitive. You can use either a resource tag or resource name or substring to define a sensitive resource. After saving your sensitive resource configuration, any dashboard that you view filters resources based on your tag or substring value setting.
What is a sensitive resource?
A resource may be considered sensitive if it hosts, stores, or transmits sensitive data. Sensitive data is information that is stored, processed, or managed by an individual or organization; it is information is confidential and only accessible to authorized users with proper permission, privileges, or clearance to view it.
Some examples of sensitive data include financial information, protected health information (PHI), credential data, customer information, trade information, proprietary information, government information, and certain types of personally identifiable information (for example, social security numbers and bank account numbers).
Because hosting, storing, or transmitting sensitive data can pose considerable security and legal risks to any organization, it’s important to identify which resources contain it, to establish criteria for what qualifies as sensitive data, to determine all the users who have access to it, and lastly, to know which users are accessing sensitive resources and when.
StrongDM already helps organizations maintain sensitive data protection through privileged access control to sensitive information systems and careful management of user authentication processes. StrongDM, however, does not know what is on your resources or how you classify them. It is up to you to identify sensitive resources. Reports provide the tools that enable you to specify which of your organization’s resources are considered sensitive.
Designate sensitive resources by resource tag
When designating sensitive resources by resource tag, enter your desired tag in the format <KEY>=<VALUE> (for example, sensitive=true). The value is optional and may be left empty. You may enter up to five tags, and if a resource has any of the specified tags, it is designated as sensitive.
Tag details
- Maximum key length: 128 UTF-8 characters
- Maximum value length: 256 UTF-8 characters
- Maximum 50 tags per entity
- Allowed characters: letters, numbers, and spaces representable in UTF-8, and the following characters:
+ - = . _ : / @ - Case-sensitive:
team=StrongDMis different fromteam=strongdm - An entity can only have one value of a key at a time (for example, if you have two tags,
sensitive=yesandsensitive=no, you can only assign one of them to a resource).
Designate sensitive resources by resource name substring
When designating sensitive resources by resource name substring, enter any substring value (for example, mysql-02-sensitive or Postgres-exampleapp-4). The system checks for this value in all resource names and displays the matched resources in dashboards.
Access Workflows
The Access Workflows dashboard provides a summary of how temporary access granted by Access Workflows is being used in the organization.
With the Access Workflows dashboard, StrongDM admins can:
- View a summary of active access grants and access requests.
- Filter results based on status (pending, timed out, canceled, denied) of access grants or access requests.
- Filter results to show access grants approved by a particular approver.
- Filter results to show access grants approved manually or automatically.
- Filter results to show only grants that are active or inactive.
- Filter results to show access requests from integrations.
- Audit all requests made by a user or for a resource or workflow.
- Select a time range of up to 13 months for review.
- Export data in the format that works for your organization.
Data information
Access Workflows data is compiled from access requests from the selected time period. The default is 28 days.
This report shows users, resources, workflows, and approvers who have recent access grant activity.
To appear in this report:
- Users must have submitted an access request or had an access grant active during the selected time period.
- Resources must have been associated with an access request or an access grant during the selected time period.
- Workflows must have been associated with an access request or an access grant during the selected time period.
- Approvers must have approved an access grant during the selected time period.
Metrics
The following Access Workflows metrics are available in exported dashboards.
| Metric name | Description | Example |
|---|---|---|
| Access Requests Created Time | Date and time when the access request was created | 2025-03-10 12:00:00 |
| Access Requests Start From Time | Requested start date and time indicated in the access request | 2025-03-06 13:01:10 |
| Access Requests Status | Access request status (canceled, denied, pending, or timed out) | Pending |
| Requests Status Time | Date and time of the last access request status update | 2025-03-05 17:06:15 |
| Approver Name Email | Approver’s name (first and last) and user email | Alice Glick -- alice.glick@strongdm.com |
| Users Name Email | User name (first and last) and user email | Bob Belcher -- bob.belcher@strongdm.com |
| Workflows Name | Name of workflow | RW Admin Workflow |
Auditor Insights
The Auditor Insights dashboard displays information about all the roles, users, resources, and tags in an environment. This information helps companies to run external audits and understand who has access to which resources. StrongDM admins can use this information to show compliance with auditor requirements, as well as to understand which areas of their organization have more access than needed. This dashboard is often used either to determine which users had access to resources at a given time or to prove that a user no longer has access to sensitive resources after leaving a role or the organization.
With the Auditor Insights dashboard, StrongDM admins and auditors can:
- View the many relationships between roles, users, resources, and tags.
- View the roles assigned to a user or set of users.
- View the roles that grant access to a resource or set of resources.
- View the roles that grant access to resources with a tag or set of tags.
- View the resource types and specific resources that a user or set of users can access.
- View the users who have access to a resource or set of resources.
- View individual grants.
- Filter results for a specific time period.
- Filter results to show access information from only temporary grants or permanent grants.
- Click on any role, user name, resource name, resource type, tag, access type, or date to filter results even further.
- Export data in the format that works for your organization to meet audit needs.
Data information
Auditor Insights data is compiled from the following:
- Role-based permanent grants active during the selected time period
- Temporary grants active during the selected time period
To appear in this report:
- Roles must have provided a grant that was active at any time during the selected time period.
- Resources must have been associated with a permanent or temporary grant active during the selected time period.
- Users must have had a permanent or temporary grant active during the selected time period.
- Resource types must have been associated with a resource with a permanent or temporary grant active during the selected time period.
- Tags must have been associated with a resource with a permanent or temporary grant active during the selected time period.
Metrics
The following Auditor Insights metrics are available in exported dashboards.
| Metric name | Description | Example |
|---|---|---|
| Datasources Dbtype Alias | Database type name | amazones |
| Datasources Name | Resource name | Example |
| Derived Role Grants Combined Created Time | Date and time when derived role grants combined were created | 2024-11-15 22:31:32 |
| Derived Role Grants Combined Deleted Time | Date and time when derived role grants combined were deleted | 2024-11-16 20:31:00 |
| Temporary Grants Count Created Time | Date and time when temporary grants were created | 2024-11-19 17:57:54 |
| Temporary Grants Count Deleted Time | Date and time when temporary grants were deleted | 2024-11-19 18:12:40 |
| Users Name Email | User name (first and last) and user email | Bob Belcher -- bob.belcher@strongdm.com |
Executive Summary
The Executive Summary dashboard provides CISOs and security teams a high-level overview of security posture as it pertains to privileged access management. The dashboard shows how many users actually interact with the resources to which they have been granted access. Access grants, resources, users, and sessions are shown as numbers, while utilization of grants, resources, and users is shown as percentages. As an example, a high number of grants with a low resource utilization percentage could mean that users are overprovisioned for access.
With the Executive Summary dashboard, you can do the following:
- View summarized information about user and resource utilization and activity.
- Review utilization and activity trends over time in order to take corrective action, if needed.
- Select a time range of up to 13 months for review.
Data aggregation
The Executive Summary dashboard aggregates data into 24-hour periods (complete UTC calendar days) from 0000 UTC to the next 0000 UTC, 24 hours later. If you view data on January 2, for example, the last point in the time series will show the state of your organization at the end of January 1 (roughly 2359 UTC on January 1). The “past” UTC midnight of a date is the cut off time. For example, for today, any user or resource created after 12:01 a.m. is not counted, and similarly, any user or resource deleted after 12:01 a.m. is not counted. The same logic applies for any date range (for example, if the last month, October, is selected, the cut off time is 12:01 a.m. UTC on October 31).
This dashboard is designed to show trends over time, so it doesn’t have aggregations that include up-to-the-minute data from the organization. For such up-to-the-minute data, use the Admin UI, CLI, or SDKs.
Data information
Executive Summary data is compiled from the following:
- Role-based permanent grants active during the selected time period
- Temporary grants active during the selected time period
- Sessions that occurred during the selected time period
- Inactive users as of the current time
To appear in this report:
- Grants must have provided access to a user during the selected time period.
- Resources must have been associated with a permanent or temporary grant active during the selected time period.
- Users must have not had any activity in the last 90 days.
- Access requests must have been submitted or provided access during the selected time period.
Metrics
To view Executive Summary metrics, click one of the following buttons located at the bottom of the dashboard. Clicking one of the buttons opens the relevant dashboard in a new browser tab or window, where you can download and view metrics for it.
- View Requests: Opens the Access Workflows dashboard
- View Grants: Opens the Auditor Insights dashboard
- View Session Activity: Opens the User Activity dashboard
- View Utilization Opens the Utilization dashboard
Standing Access
The Standing Access report provides information about how users received access (such as through permanent grants from roles, or temporary grants from workflows or policies), how long users have had access to resources, and whether or not users have used the access they’ve been given. In addition, it provides suggested actions to take to reduce unused access. This information is useful for assessing security risks and determining which users actually need access to certain resources and whose access should be revoked or converted to temporary access.
In general, standing access is less safe than temporary access. This dashboard is designed to help you find troublesome spots of standing access (users, resources, or roles) and identify what would provide the highest impact if certain permanent access grants are changed to Just-in-Time (JIT) access, where JIT access is access granted upon request or on demand.
The Standing Access report presents information in the following tabs: Scores, Users, Roles, Resources, and Remediations. By clicking into these Standing Access report tabs, StrongDM admins can view:
- Scores for JIT, role utilization, and overall access, and how they are calculated
- JIT Access and Role Utilization scores for each user
- Utilization score and JIT resource overlap for each role
- Distribution of your resources based on the origin of the grant
- Remediation steps to remove users and resources from roles in order to reduce standing access
Scores
The Scores area of the Standing Access report uses data from the access grants and user sessions from the last 90 days to calculate three scores for your organization: JIT Access Score, Role Utilization Score, and Overall Score. Higher scores represent less standing access, indicating that your organization is getting closer to zero-trust authorization. These scores can help you to quickly glean the amount of standing access granted to users (where standing access is a permanent access grant created when a user or a resource is assigned to a role) versus the amount of temporary access granted to a user (where access is given upon request and approval, for a specified, limited amount of time).
The JIT Access Score evaluates all of your grants, and calculates the percentage of grants that provided access on a temporary basis versus the grants derived from a role. A JIT Access Score of 100% means your organization has no standing access because all of your grants provide access on a temporary basis.
The Role Utilization Score calculates the percentage of permanent grants where the user accessed the resource. A Role Utilization Score of 100% means all of your permanent grants are utilized. If possible, you should eliminate access through permanent grants in your organization. Where eliminating permanent grants is not feasible yet, a high Role Utilization Score indicates that the permanent grants in your organization are at least being used.
The Overall Score is an average of the JIT Access Score and Role Utilization Score.
The Standing Access Report is meant to assist StrongDM administrators to reduce the amount of standing access by changing permanent grants from roles into temporary grants from workflows and policies, particularly those permanent grants that often go unused.
Data information
Standing Access data is compiled from the following:
- Permanent grants active today
- Temporary grants active in the previous 90 days
- Sessions from the previous 90 days
To appear in this report:
- Users must have a permanent grant active today or a temporary grant active in the previous 90 days.
- Resources must have a permanent grant active today or a temporary grant active in the previous 90 days.
- Roles must be responsible for granting permanent access that was active today.
User Activity
The User Activity dashboard provides details about user sessions. Admins can use the dashboard to troubleshoot issues with users or resources by filtering to the relevant time and context. In additions, admins can use it to get a detailed understanding of what users access or who is accessing specific resources and resource types.
With the User Activity dashboard, StrongDM admins can:
- Get an at-a-glance view of sessions within StrongDM.
- Find problematic sessions based on concurrency and length of sessions.
- Filter results by user, resources, resource types, and tags to review specific session activities.
- Filter results to show queries for sensitive resources only.
- View individual sessions and grants.
- Select a time range of up to 13 months for review.
- Export data in the format that works for your organization.
Data information
User Activity data is compiled from sessions that occurred during the selected time period.
To appear in this report:
- Users must have had a session that occurred during the selected time period.
- Resources must have had a session that occurred during the selected time period.
- Resource types must have been associated with a resource with a session that occurred during the selected time period.
- Tags must have been associated with a resource with a session that occurred during the selected time period.
Metrics
The following User Activity metrics are available in exported dashboards.
| Metric name | Description | Example |
|---|---|---|
| Datasources Dbtype Alias | Database type name | amazones |
| Datasources Name | Resource name | Example |
| Users Name Email | Full name and email address of the user | Bob Belcher -- bob.belcher@strongdm.com |
| Users Table Partition Time | Date and time of the user table partition | 2024-11-19 17:58:00 |
| Users Table Updated Time | Date and time when the user table was updated | 2024-11-19 17:58:52 |
| Users Table Count | User table count | 1 |
Utilization
The Utilization dashboard provides information about the activity and inactivity of users and resources within your StrongDM environment. Admins can use this dashboard to identify stale or unused users, resources, and roles, and then make decisions about removing unused items. For example, unused user accounts, unused resources, or roles with no users may be removed because they’re unnecessary. Resources with no roles, for example, also may be removed if your organization doesn’t provide Just-in-Time (JIT) access to them.
With the Utilization dashboard, StrongDM admins can view:
- Latest authentication per user
- Latest query per user
- Latest query per resource
- Roles that are active but are unassigned to resources
- Resources that have no roles assigned to them
- Users who have no roles assigned to them
- Resources that have never had activity
- Users who have never had activity/sessions
- For User Authentications, Users with Queries, and Resources with Queries widgets, all the above information for various date ranges, including:
- Greater than 90 days ago
- Less than 90 days ago
- Less than 30 days ago
- Less than 7 days ago
- Less than 1 day ago
Data information
Utilization data is compiled from the following:
- User authentications that occurred during the selected time period
- Sessions that occurred during the selected time period
To appear in this report:
- User Authentications: Users must have had an authentication that occurred during the selected time period.
- Users with Queries: Users must have had a query that occurred during the selected time period.
- Resources with Queries: Resources must have had a query that occurred during the selected time period.
- Empty Roles: Roles are currently active and do not have a user assigned.
- Users without a Role: Users are currently not assigned to a role.
- Resources without a Role: Resources are currently not assigned to a role.
- Inactive users: Users have no queries.
- Inactive Resources: Resources have no queries.
Metrics
The following Utilization metrics are available in exported dashboards.
| Metric name | Description | Example |
|---|---|---|
| Authentications List of Source | Source of user activity, either web (Admin UI) or native (desktop app) | web |
| Empty Roles Created Time | Date and time when the empty role was created | 2024-11-15 15:05:47 |
| Empty Roles Name | Name of empty role | Example |
| Inactive Resources Created Time | Date and time when the inactive resource was created | 2024-08-01 23:00:15 |
| Inactive Resources Name | Name of the inactive resource | Example |
| Inactive Users Created Time | Date and time when the inactive user was created | 2024-08-05 23:00:15 |
| Inactive Users Name Email | Name (first and last) and user email of the inactive user | Alice Glick -- alice.glick@strongdm.com |
| Latest Query Ids Last Query Time | Date and time of the latest query ID’s last query time | 2024-11-18 19:36:47 |
| Latest Resource Query Created Time | Date and time when the latest resource query was created | 2024-08-05 23:00:15 |
| Latest Resource Query Name | Name of the resource that was queried | Example |
| Latest User Query Created Time | Date and time when the latest user query was created | 2024-06-25 17:01:35 |
| Latest User Query Name Email | Name (first and last) and email of latest query to make a query | Alice Glick -- alice.glick@strongdm.com |
| Logged In Users Created Time | Date and time when the logged-in user was created | 2024-08-01 18:56:57 |
| Logged In Users Last Login Time | Date and time when the logged-in user last logged in | 2024-10-28 20:09:05 |
| Logged In Users Name Email | Name of logged-in user name (first and last) and user email | Bob Belcher -- bob.belcher@strongdm.com |
| Orphan Resources Created Time | Date and time when the resource without a role was created | 2024-06-25 17:01:35 |
| Orphan Resources Dbtype Alias | Database type name of the resource without a role | amazones |
| Orphan Resources Name | Name of the resource without a role | No Role |
| Orphan Users Created Time | Date and time when the user without a role was created | 2024-06-25 17:01:35 |
| Orphan Users Name Email | Name of the user without a role (first and last) and the user email | Alice Glick -- alice.glick@strongdm.com |
All Metrics
The following table describes all metrics found in exported dashboards.
| Metric name | Description | Example | Dashboard(s) |
|---|---|---|---|
| Access Requests Start From Time | Date and time when access requests started | 2024-11-04 15:00:00 | Access Workflows |
| Approver Name Email | Approver’s name (first and last) and user email | Alice Glick -- alice.glick@strongdm.com | Access Workflows |
| Authentications List of Source | Source of user activity, either web (Admin UI) or native (desktop app) | web | Utilization |
| Datasources Dbtype Alias | Database type name | amazones | Auditor Insights, User Activity |
| Datasources Name | Resource name | Example | Auditor Insights, User Activity |
| Derived Role Grants Combined Created Time | Date and time when derived role grants combined were created | 2024-11-15 22:31:32 | Auditor Insights |
| Derived Role Grants Combined Deleted Time | Date and time when derived role grants combined were deleted | 2024-11-16 20:31:00 | Auditor Insights |
| Empty Roles Created Time | Date and time when the empty role was created | 2024-11-15 15:05:47 | Utilization |
| Empty Roles Name | Name of empty role | Example | Utilization |
| Inactive Resources Created Time | Date and time when the inactive resource was created | 2024-08-01 23:00:15 | Utilization |
| Inactive Resources Name | Name of the inactive resource | Example | Utilization |
| Inactive Users Created Time | Date and time when the inactive user was created | 2024-08-05 23:00:15 | Utilization |
| Inactive Users Name Email | Name (first and last) and user email of the inactive user | Alice Glick -- alice.glick@strongdm.com | Utilization |
| Latest Query Ids Last Query Time | Date and time of the latest query ID’s last query time | 2024-11-18 19:36:47 | Utilization |
| Latest Resource Query Created Time | Date and time when the latest resource query was created | 2024-08-05 23:00:15 | Utilization |
| Latest Resource Query Name | Name of the resource that was queried | Example | Utilization |
| Latest User Query Created Time | Date and time when the latest user query was created | 2024-06-25 17:01:35 | Utilization |
| Latest User Query Name Email | Name (first and last) and email of latest query to make a query | Alice Glick -- alice.glick@strongdm.com | Utilization |
| Logged In Users Created Time | Date and time when the logged-in user was created | 2024-08-01 18:56:57 | Utilization |
| Logged In Users Last Login Time | Date and time when the logged-in user last logged in | 2024-10-28 20:09:05 | Utilization |
| Logged In Users Name Email | Name of logged-in user name (first and last) and user email | Bob Belcher -- bob.belcher@strongdm.com | Utilization |
| Orphan Resources Created Time | Date and time when the resource without a role was created | 2024-06-25 17:01:35 | Utilization |
| Orphan Resources Dbtype Alias | Database type name of the resource without a role | amazones | Utilization |
| Orphan Resources Name | Name of the resource without a role | No Role | Utilization |
| Orphan Users Created Time | Date and time when the user without a role was created | 2024-06-25 17:01:35 | Utilization |
| Orphan Users Name Email | Name of the user without a role (first and last) and the user email | Alice Glick -- alice.glick@strongdm.com | Utilization |
| Temporary Grants Count Created Time | Date and time when temporary grants were created | 2024-11-19 17:57:54 | Auditor Insights |
| Temporary Grants Count Deleted Time | Date and time when temporary grants were deleted | 2024-11-19 18:12:40 | Auditor Insights |
| Users Name Email | User name (first and last) and user email | Bob Belcher -- bob.belcher@strongdm.com | Access Workflows, Auditor Insights, User Activity |
| Users Table Count | User table count | 1 | User Activity |
| Users Table Partition Time | Date and time of the user table partition | 2024-11-19 17:58:00 | User Activity |
| Users Table Updated Time | Date and time when the user table was updated | 2024-11-19 17:58:52 | User Activity |
| Workflows Name | Name of workflow | RW Admin Workflow | Access Workflows |