<img src="https://ws.zoominfo.com/pixel/6169bf9791429100154fc0a2" width="1" height="1" style="display: none;">

We're blowing the whistle on Legacy PAM 🏀 Join us for an Access Madness Webinar on March 28

Search
Close icon
Search bar icon

The Ultimate Guide to Observability

Observability beyond logs, metrics, and traces.
Last updated January 18, 2023 • 9 min read •
John Turner, author of What is Observability? Beyond Logs, Metrics, and Traces | StrongDM
Written by Customer Engineering Expert StrongDM
Justin McCarthy
Reviewed by Co-founder / CTO StrongDM

Summary: In this article, we’ll take a big-picture look at Observability. First, you’ll learn about the history, objectives, and benefits of observability as well as the challenges it poses for organizations. Then you’ll be introduced to a theoretical framework for data observability, typical business use cases as well as the three pillars of observability. You’ll also understand the important distinctions between observability and monitoring and how observability contributes to the work of development and IT operations (DevOps) teams. Finally, we’ll present best practices for implementing observability, the elements of a good observability tool, and how to choose the right one for your organization.

What is Observability?

Observability is defined as a measure of how well the internal states of a system can be inferred from knowledge of its external outputs. When used in the IT context and with reference to the work of software development (Dev) and IT operations (Ops) teams, the term observability describes the ability to understand and manage the performance of all the systems, servers, applications, and other resources constituting an enterprise technology stack.

Observability is achieved via a combination of observability tools and methodologies—the observability platform—adopted specifically to enable DevOps teams to discover, triage, and resolve systems issues that threaten uptime and reliability and undermine the achievement of enterprise goals.

More simply, observability is distinct from monitoring, which passively tracks pre-defined metrics in discrete systems. Instead, observability makes actionable use of data by enabling a holistic view across the entirety of a technology stack. And it aggregates all the data produced by all the IT systems to produce real-time insights, identify anomalies, determine their root cause, and proactively resolve them.

History of Observability

The term “observability” was first coined in the 1960s by Rudolf Emil Kálmán, a Hungarian-American electrical engineer, mathematician, and inventor, to describe how well a system can be measured by its outputs.

Kálmán’s work on the mathematical study of systems led to his co-invention of the Kalman filter. This is a mathematical technique widely used in the digital computers of control systems, navigation systems, avionics, and outer-space vehicles to extract a signal from a long sequence of noisy or incomplete measurements.

Although it was in routine use amongst engineers working in process and aerospace industries, the term observability did not enter the lexicon of IT practitioners until some 30 years afterwards.

One of its first appearances was in a blog post published in 2013, where engineers at Twitter described the “observability stack” they’d created to monitor the health and performance of the “diverse service topology” that resulted after their move from a monolithic to a distributed IT architecture.

The move meant a dramatic escalation in the overall complexity of their systems and the interaction between those systems. They called their observability solution “an important driver for quickly determining the root cause of issues, as well as increasing Twitter’s overall reliability and efficiency.”

Current Trends

Almost 20 years later, in line with the routine adoption of complex, multilayered, cloud-based infrastructures using microservices and containers, the concept of observability in enterprise IT has become mainstream.

The role of the COVID-19 pandemic in spurring an already galloping trend cannot be underestimated. Synergy Research Group reported in December 2020 that as enterprises rushed to enable remote working for employees and digital engagement with customers, spending on cloud infrastructure services (IaaS, PaaS, and hosted private cloud services) and SaaS reached $65 billion in the third quarter, up 28% from the third quarter of 2019.

According to the Enterprise Strategy Group’s State of Observability 2021 survey, global IT leaders are convinced of the value of observability. A full 90% of survey participants said they expected it to become the most important pillar of enterprise IT.

What are the Objectives of Observability?

From the perspective of enterprise software development and IT operations (DevOps) and site reliability engineering (SRE) teams, the overall objective of observability is to ensure that the enterprise IT stack is available and that it’s performing reliably.

Business Success

System availability and performance are not stand-alone goals. They underpin business success in the sense that non-availability and underperformance negatively affect user experience and customer satisfaction. In extreme cases, they could lead to reputational damage, revenue loss, and even business failure.

As reported in the findings from the State of Observability 2021 report:

  • 53% of respondents said app issues had resulted in customer or revenue loss.
  • 45% reported lower customer satisfaction as a result of service failures.
  • 30% reported losing customers as a consequence.

In a complex, multilayered, distributed computing environment with so many interdependencies that they’re impossible to keep track of, the promise of full-stack observability is that it enables organizations to find the proverbial needle in the haystack—that is, to identify and respond to systems issues before they affect customers.

Security and Compliance

Observability also plays a role in ensuring enterprises comply with their legal obligation to protect sensitive data from unauthorized access. From a security perspective, observability tools can be used to detect breaches and intrusions and prevent data leaks. A useful business by-product of observability is the opportunity to avoid or reduce the fines levied by governments and regulatory bodies for non-compliance.

Marketing

As well as improving the user experience and boosting brand reputation, observability practices can contribute to revenue growth and profitability, for example, by providing analytical data about customer behavior that helps marketers make strategic decisions.

Benefits of Observability

The key benefit of observability is that it can provide multiple stakeholders with actionable insights into the complex, multilayered, distributed IT infrastructure that’s become a feature of the modern enterprise. As data volumes increase, the complexity will also increase.

DevOps and SRE teams

For DevOps and SRE teams, end-to-end data visibility and monitoring across multi-layered IT architecture simplifies root cause analysis. This means they can quickly identify and resolve issues no matter where they originate or at what point in the software lifecycle they emerge.

As well as being able to identify issues in real-time, teams can also automate parts of the triage process. That allows them to instantly resolve even unanticipated problems and saves both time and money.

  • According to the State of Observability 2021 report, amongst owners of hybrid, multi-cloud infrastructures, mature observability users are 2.9 times more likely to report improved visibility into application performance. In the case of public cloud infrastructure, visibility is improved two-fold.
  • High maturity observability practices are also correlated with speedier root cause identification. The result is quicker fixes for complex, service-crashing crises—which might be averted altogether.

Security and Compliance

With full visibility into the enterprise IT stack, teams can be alerted to and proactively fend off or nip security incidents in the bud. These could include data breaches or outright attacks that threaten data integrity and increase the risk of non-compliance with data privacy regulations—as well as the associated costs.

Enterprise Success

Findings from the State of Observability 2021 report show a strong correlation between observability and business success. As well as being 4.5 times more likely to report successful digital transformation initiatives, organizations with the most advanced observability practices also report 60% more new services, products, and revenue streams than organizations with rudimentary observability.

Challenges of Observability

A recent poll amongst more than 200 senior engineering professionals responsible for observability and log data management at companies across the United States revealed that 74% of companies are struggling to achieve true observability.

Complaints cited by survey participants include their inability to find tools to support multiple use cases. Typically, multiple teams need to extract actionable insights from the same data—including development, IT operations, site reliability engineering, and security. A total of 67% of respondents reported barriers to collaboration across teams while 58% experienced difficulties with routing security events.

Cost is also an issue. In an attempt to control the costs associated with managing increased volumes of machine data, companies limit the amount of log data ingested or stored. But as a result, instead of having the full information needed to troubleshoot a problem, developers have only sample data—and it’s insufficient. This slows down troubleshooting, debugging, and incident response efforts, and increases security risk.

As well as untenable storage costs that limit scalability, companies also struggle with data variety. Given that most organizations maintain an average of 400 data sources including computers, smartphones, websites, social media networks, e-commerce platforms, and IoT devices, it’s not surprising that 32% of survey respondents reported difficulties with ingesting data into a standard format and 30% with routing it into multiple tools for different use cases.

More than half of the respondents said they’d like to replace the tools they’re currently using.

The Observability Framework

Guidelines from the Google Cloud Architecture Center list the capabilities to be built into the design of an observability solution as follows:

  • Reporting on the overall health of systems: are systems functioning and are sufficient resources available?
  • Reporting on system state as experienced by customers: if a system is down, are customers aware of it and is their experience negatively affected?
  • Monitoring for key business and systems metrics
  • Explicitly documented Service Level Objectives with defined values indicating success or failure
  • Tooling to help understand and debug systems in production
  • Tooling to identify unanticipated problems, typically referred to in observability circles as “unknown unknowns”
  • Access to tools and data that help trace, understand, and diagnose infrastructure problems in the production environment, including interactions between services

Examples of Observability

The large-scale adoption of cloud native services, including microservice, container, and serverless technologies over the last decade, has burdened organizations with vast, geographically distributed spiderwebs of interdependent systems. Tracking and monitoring the complex interrelationships between these systems to identify and fix outages and other problems is beyond the capabilities of traditional monitoring tools.

Observability fulfills this function by giving DevOps teams visibility across complex, multilayered architectures so they can identify the links in a process and quickly and efficiently locate the cause of a problem.

Twitter

Twitter’s adoption of observability to gain visibility into hundreds of services across multiple datacenters is extensively documented in this blog post.

Stripe

Another much-talked-about example is payment provider Stripe’s use of distributed tracing to find the causes of failures and latency within networked services—of which as many as ten could be involved in the processing of a single one of the millions of payments the company manages daily.

With its payments platform a natural target for payments fraud and cybercrime, Stripe has also developed early fraud detection capabilities, which use machine learning models based on similarity information to identify potential bad actors.

Uber and Facebook

Like Stripe, Uber and Facebook also make use of large-scale distributed tracing systems. While Uber’s system, Jaeger, serves mainly to provide engineers with insights into failures in their microservices architecture by automating root cause analysis, Facebook uses distributed tracing to gain detailed information about its web and mobile apps. Datasets are aggregated in Facebook’s Canopy system, which also includes a built-in trace-processing system.

Network Monitoring

Network monitoring is a further example of observability in practice, and it’s used to help pinpoint the reason for performance failures—which might otherwise have been wrongly blamed on an application or other teams.

By accurately identifying network-related incidents, network monitoring software may reveal that a particular problem originates at the ISP or third-party platform level. The result is an easing of internal tensions as well as a speedy resolution of the problem at hand.

The Three Pillars of Observability

Metrics, logs, and traces are the three data inputs, which together provide DevOps and SRE teams with a holistic view into distributed systems in cloud and microservices environments. Also called the Golden Triangle of Observability in Monitoring, these three pillars underpin the observability architecture that enables IT personnel to identify and diagnose outages and other systems problems regardless of where the servers are.

Metrics

Observability metrics are selected key performance indicators (KPIs) such as response time, peak load, requests served, CPU capacity, memory usage, error rates, and latency. These KPIs:

  • quantify performance
  • produce alerts such as when a system is down or load balancers reach capacity
  • monitor events for anomalous activities

Traces

Traces enable DevOps admins to locate the source of an alert. This is because they account for a series of distributed events and what happens between them. Tracking system dependencies in this way mean traces can show precisely where bottlenecks are occurring. Examples of traces that would be used to determine which part of a process is slow are:

  • API Queries
  • Server-to-Server Workload
  • Internal API Calls
  • Frontend API Traffic

Logs

Observability logs answer the “who, what, where, when, and how” questions regarding access activities. Because microservers typically use different data formats, log data must be structured—which complicates aggregation and analysis.

While logs provide unmatched levels of detail, their sheer volume makes them challenging to index and expensive to manage. Many organizations struggle to log every single transaction, and even when they do, logs cannot show concurrency in microservices-heavy systems.

The three pillars contribute different views and don’t work well in isolation. Transforming the data each provides into real insights requires harnessing their collective value in an analytics dashboard, which reflects the relationships between the three elements and contextualizes the data in terms of measurable, objective-based benchmarks.

For a deeper dive analysis of the three pillars of observability, read our dedicated blog post.

Observability and DevOps

The key task of DevOps teams is to ensure reliability, availability, and performance across the IT infrastructure for which they’re responsible. Observability solutions enable DevOps teams to proactively detect anomalies, analyze issues, and resolve problems by garnering real-time insights into the health and status of the full range of systems, servers, applications, and resources.

Observability is enabled by an observability platform and by observability tools. The outputs allow DevOps teams to understand not only whether each system is working but also why it’s not working.

In combination, observability tools:

  • monitor the health and status of the systems using metrics, logs, and traces
  • detect and report anomalies
  • provide the data required to quickly troubleshoot and solve issues

Observability across the software lifecycle

Beyond its use in the production environment, observability is gaining recognition within the DevOps community as critical to the software lifecycle as a whole. This is confirmed by the findings from the State of Observability 2021 survey where 91% of the decision makers polled see observability as critical to every stage of the software lifecycle. They place especially high importance on planning and operations.

Observability benefits identified by this group include:

  • improved development speed, quality, and agility
  • cost effectiveness
  • improved user experiences
  • better engineer morale

Observability vs Monitoring vs Telemetry vs Visibility

Observability vs Monitoring

Observability and monitoring are often spoken of together in reference to IT software development and operations (DevOps) strategies. While both play an important role in ensuring the safety of systems, data, and security perimeters, observability and monitoring are complementary, but not interchangeable, capabilities.

The essential difference between the two lies in the fact that monitoring tools reveal performance issues or anomalies a DevOps team can anticipate while observability infrastructure takes care of multifaceted, often unanticipated issues such as those arising from the interplay between complex, cloud-native applications in distributed technology environments.

  • Monitoring collects and analyzes predetermined data pulled from individual systems.
  • Observability aggregates all data produced by all IT systems.

As such, monitoring is static and one-dimensional because monitoring tools track expected events in specified applications and systems. Observability on the other hand is contextual, proactive, and dynamic. It takes account of the interactions between multiple—possibly even hundreds of—systems at once and explores properties and patterns not defined in advance.

While monitoring alerts a DevOps team to a potential known issue, observability helps the team detect and solve the root cause of a previously unknown issue. This is because even when a particular endpoint isn’t directly observable, the information which comes from monitoring its performance can be used with the help of observability tools (metrics, logs, and traces) not only to identify an issue in real-time, but also to automate parts of the triage process so that issues can be instantly detected across the system as a whole.

For a full discussion of observability vs. monitoring, read our dedicated blog post.

Observability vs Telemetry

Telemetry, or more specifically telemetry data, facilitates and enables observability.

Derived from the Greek roots tele ("remote") and metron ("measure”), telemetry is the process by which data is gathered from across disparate systems to paint a picture of the internal state of the larger system that contains them.

In the case of the human body, for example, telemetry data such as blood pressure, temperature, and heart rate provides a window through which its internal state can be observed. For complex enterprises, the telemetry data measures performance across each element of the technology infrastructure from servers to applications and includes user analytics as an indicator of system health.

In the IT context, there are three types of telemetry:

  • Metrics: indicate there is a problem
  • Traces: identify the source of the problem
  • Logs: provide the forensic detail which reveals the root cause of the problem

Telemetry tools also standardize the data collected so it can be usefully analyzed by DevOps teams. This is vital in complex, cloud-native environments where data comes from a variety of sources and is of different types: structured, semi-structured, and unstructured.

While telemetry tools offer robust data collection and standardization, they do not independently provide the deep insight DevOps teams need to quickly understand why an issue is occurring so it can be effectively resolved. Effective observability depends on all three types simultaneously.

Observability vs Visibility

A key advantage of observability is that it enables organizations to discover the root cause of systems problems and then resolve them— saving time or money for the organization, improving the customer experience, preserving profitability, and loosening production bottlenecks.

Root cause analysis and problem resolution are possible because observability solutions take account of an IT infrastructure in its entirety. That means DevOps teams have end-to-end visibility of data as it moves around even the most complex, multi-layered IT architectures and interacts with different tools and systems. That visibility enables them to quickly identify data issues no matter where they originate. In turn, the faster mean time to detection (MTTD) leads to a faster mean time to resolution (MTTR).

MTTD is a key performance indicator in incident management and indicates the average amount of time required for an organization to discover an incident. Logically, the sooner an incident is known about, the sooner it can be remediated. MTTR is also an important performance indicator in incident management and denotes the average time taken to resolve a problem and restore a system to functionality.

Visibility on its own does not equate with observability. The distinction is that observability provides a holistic context for individual instances of visibility into discrete systems.
How to Implement Observability | Best Practices

IAM Introducing observability into an organization is a major step which involves a succession of conscious decisions and collaborative actions and cannot happen by chance. Rather it must be founded on an agreed commitment at all levels of the enterprise to foster data-driven decision making and promote strong data quality as well as consistency and reliability.

The first step in setting up observability is to designate a dedicated observability team whose task is to take ownership of observability in the organization, think through the approach, and design an observability strategy. The strategy should list and take into account the specific goals of the enterprise in adopting observability. It should also define and document the most important use cases for observability across the organization.

From an understanding of business priorities, the key observability statistics can be established and decisions made about the data—that is the metrics, traces, and logs—that will be needed from across the enterprise technology stack to produce those measurements.

The next step is to document data formats, data structures, and metadata, the latter group to ensure interoperability between the different types of data that will be collected. This is particularly important in large organizations with multiple teams where the tendency is to work in separate silos, each with its own terminology, dashboards, and reports.

Having a documented observability infrastructure in place encourages collaboration across divisions and sets the scene for the next steps: defining an observability pipeline and creating a centralized observability platform for data ingestion and routing to analytical tools or temporary storage.

Education sits at the center of the fundamental building blocks of an observability framework. As well as cultivating an observability culture, regular bootcamps for both existing and new staff will create understanding and engagement and ensure positive and informed action and the achievement of peak observability.

The key elements of best practices in observability implementation are listed below.

  • Assemble an observability team
  • Establish key observability metrics based on business priorities
  • Build an observability pipeline based on OpenTelemetry to standardize metrics, logs, and traces across the organization
  • Formulate and document common practices for data management, security, and governance
  • Centralize and correlate data sources
  • Select analytics tools
  • Educate teams to empower proficiency in all development teams and promote a culture of observability

How to Choose a Good Observability Tool?

Creating The elements of a good data observability tool include the following:

  • Collates, reviews, samples, and processes telemetry data across multiple data sources. Offers comprehensive monitoring across the network, infrastructure, servers, databases, cloud applications, and storage
  • Serves as a centralized repository to support data retention and fast access to data
  • Provides data visualization
  • Automates data security, governance, and operations practices
  • From a storage perspective, offers long retention periods and fast retrieval for auditing
  • Supports reasonable levels of growth in data volumes
  • Monitors data at rest from its current source—without the need to extract it—and in motion through its entire lifecycle
  • Incorporates embedded AIOps and intelligence alongside data visualization and analytics
  • Requires the minimum possible up-front work to standardize and map data
  • Requires the minimum possible adjustments to existing data pipelines

As well as possessing these characteristics, the right observability tool will be an appropriate fit with an organization’s existing architecture, integrating smoothly with each data source and with existing tools and workflows. It will also be easy to use, incorporating clear visualizations that facilitate issue review and troubleshooting by staffers.

Transform Your Organization’s Monitoring Capabilities with Data Observability

As Observability is an emerging technology. As the trend towards distributed enterprise IT infrastructures continues to gather pace, observability will continue to evolve and improve, supporting more data sources, automating more capabilities, and helping to shore up enterprise defenses against cybercrime, crippling outages, and running afoul of privacy regulations. Where observability may once have been thought of as a nice-to-have, it has become a fundamental necessity for business success.

strongDM seamlessly integrates with many data observability tools to expand your visibility into user access.

Learn how our Infrastructure Access Platform can help you understand the ways your customers access and use your data!

Book a free no-BS demo.


About the Author

, Customer Engineering Expert, is passionate about helping customers connect to the infrastructure they need to do their jobs, bringing 15+ years of experience in IT environments to his current focus on Infrastructure Automation and Security. He works in multiple cloud environments including AWS, GCP, Azure, and IBM Cloud and stays up to date on various automation tools such as Terraform and Ansible. To contact John, visit his YouTube channel.

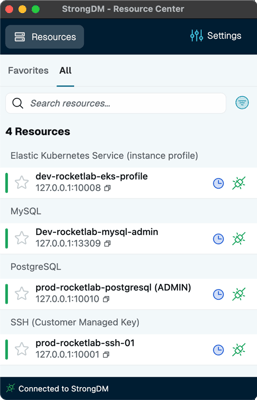
StrongDM app UI showing available infrastructure resources
Connect your first server or database, without any agents, in 5 minutes.